Java VisualVM - Monitoring an Application
Java VisualVM presents data for local and remote applications in
a tab specific for that application. When you open an application
in Java VisualVM, each application opens in a new tab in the main
window. You can have multiple application tabs open.
Monitoring an Application
You can use Java VisualVM to monitor a local application and
view real-time, high-level data on the memory heap, thread
activity, and the classes loaded in the Java Virtual Machine (JVM).
Monitoring an application imposes low overhead and can be used for
extended periods.

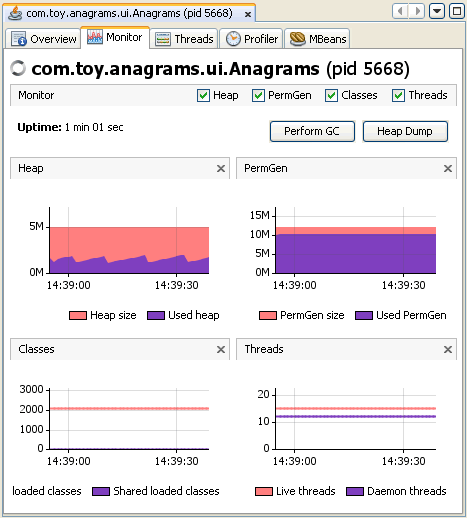
Monitoring data is displayed in the following graphs:
- Heap. The Heap graph displays the total heap size and
how much of the heap is currently used. These are the figures that
a Java technology-based application (Java application) can obtain
using the java.lang.Runtime.totalMemory() and
java.lang.Runtime.freeMemory() calls.
- PermGen. The PermGen graph displays changes in the
permanent generation area over time. The permanent generation is
the area of the heap where class and method objects are stored. If
an application loads a very large number of classes, then the size
of the permanent generation might need to be increased using the
-XX:MaxPermSize option.
- Classes The Classes graph displays an overview of the
total number of loaded classes and shared classes.
- Threads. The Threads graphs displays an overview of the
number of live and daemon threads in the application's JVM. You can
use Java VisualVM to take a thread dump if you want to capture and
view exact data on application threads at a specific point in time.
For more about working with threads, see the following document:
The Monitoring tab contains buttons that enable you to perform
the following actions:
- Perform GC. Click Perform GC to perform garbage
collection immediately.
- Heap Dump. Click Heap Dump to take a heap dump. When you
take a heap dump, a tab displaying the heap dump opens in the
application tab. A node for the heap dump appears under the node
for the application in the Applications window. For more about
working with a heap dump, see the following document:

